Experimentation (A/B Testing)
Experimentation in Flagsmith is currently in active development. This page describes the flow as it stands in the current prototype — naming, scope, and behaviour may change before general availability. Feedback welcome on the draft PR.
Screenshot placeholder — Hero image — wide shot of the Experiment Results dashboard with lift bars and the recommendation callout. Target path:
/img/experimentation/hero-results-dashboard.png
Flagsmith Experimentation lets you run controlled A/B tests on your multivariate feature flags and read the results inside Flagsmith itself. You define a hypothesis, pick the flag to split traffic on, choose which metrics matter, and Flagsmith tracks the outcome by reading evaluation and event data from your data warehouse.
This replaces the earlier "bring your own analytics" approach where Flagsmith handled variation assignment but results lived in Amplitude or Mixpanel. Everything — configuration, running, and results — now lives in one place.
Key benefits
- One workflow for the full experiment lifecycle. Configure, launch, monitor, and read results without leaving Flagsmith.
- Structured hypothesis and metric tracking. Experiments are a first-class object with a hypothesis, primary / secondary / guardrail metrics, and a significance verdict — not a free-form flag configuration.
- Reuses existing Flagsmith concepts. Assignment uses the same identity-based bucketing as multivariate flags. Target audiences use existing segments.
- Warehouse-backed metrics. Results are computed from your data warehouse (Snowflake, BigQuery, Databricks), so metric definitions stay close to where your business already stores event data.
How it fits with Flagsmith
Experimentation builds on three concepts you already use:
- Multivariate flags — every experiment runs on a multivariate flag. The flag's existing variations become the experiment's control and treatment variations.
- Segments — experiments target a segment. Users outside the segment see the flag's environment default, unchanged.
- Identities — users are bucketed by identity, the same way multivariate flag values are assigned today. A user consistently sees the same variation for the duration of the experiment.
1. Connect a data warehouse
Before you can run experiments, connect the data warehouse where your flag-evaluation and custom-event data lives. Flagsmith reads from the warehouse to compute metric values per variation.
The data warehouse connection is organisation-scoped — configure it once and every project inherits it.
See the full setup guide: Data Warehouse Integration.
Once connected and data is flowing, continue to the next step.
2. Creating an experiment
All experiment workflows start on the Experiments page in the project sidebar (alongside Features, Segments, and Identities). The list is the hub: it's where you launch a new experiment and where you click in to read the results of an existing one.
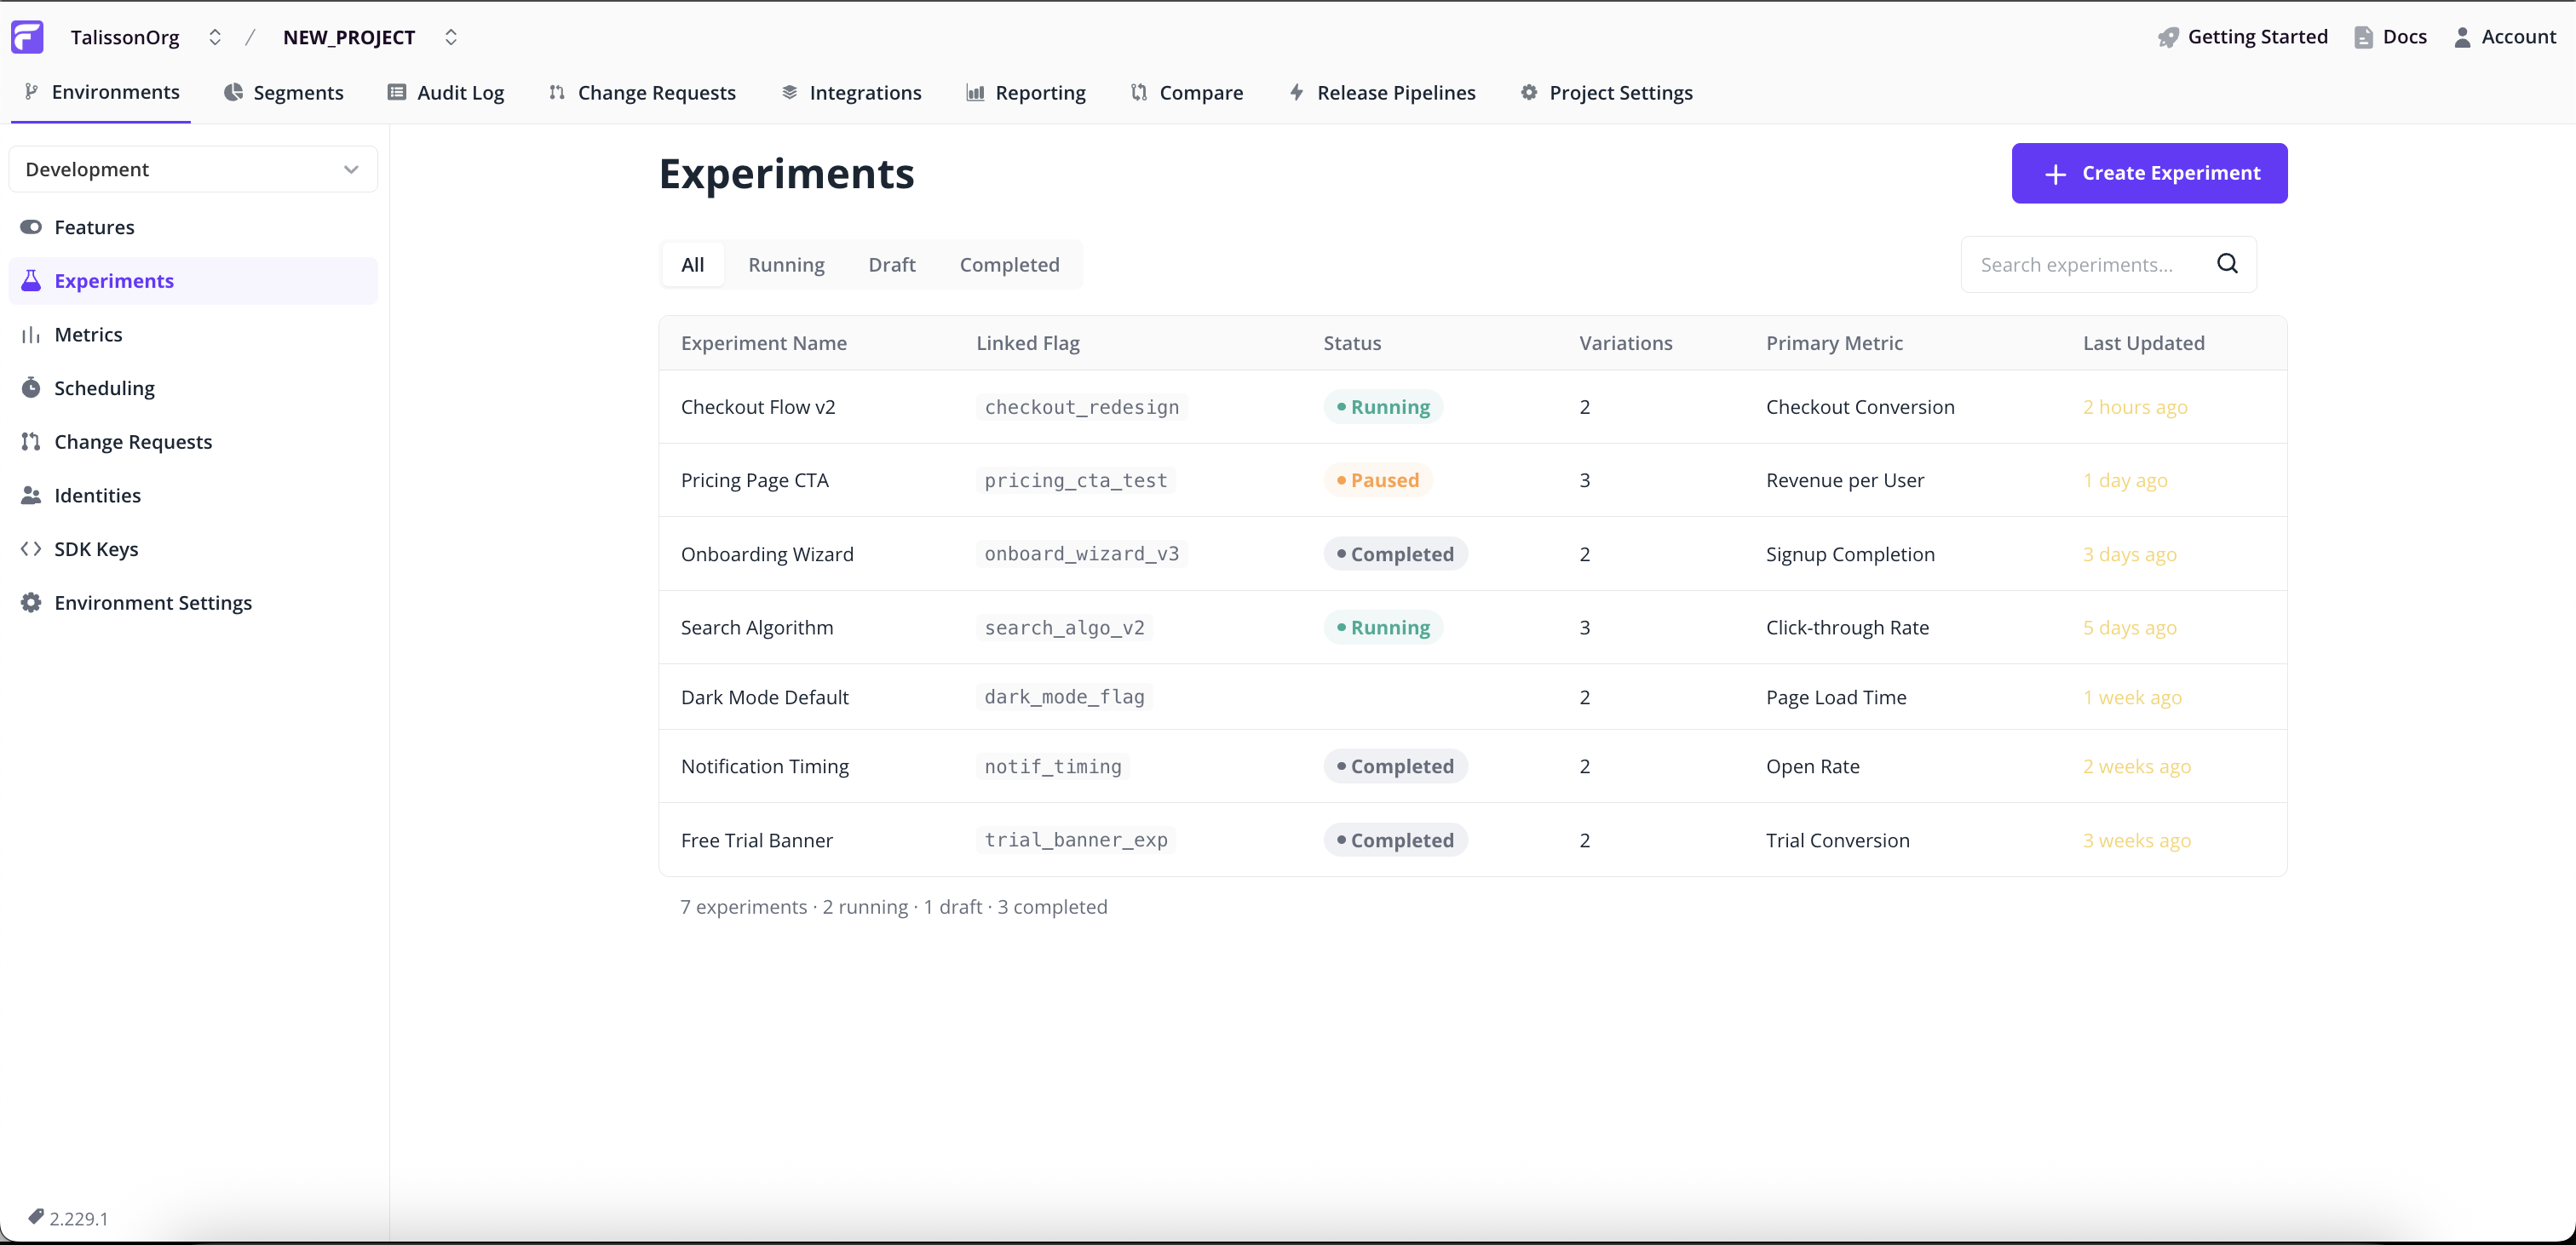
Creating an experiment is a 5-step wizard. Each step validates before you continue, and you can jump back to any earlier step from the Review & Launch summary.
Step 1: Open the Experiments list
- Go to Experiments in the project sidebar.
- Click Create Experiment in the top right.
Step 2: Experiment Details
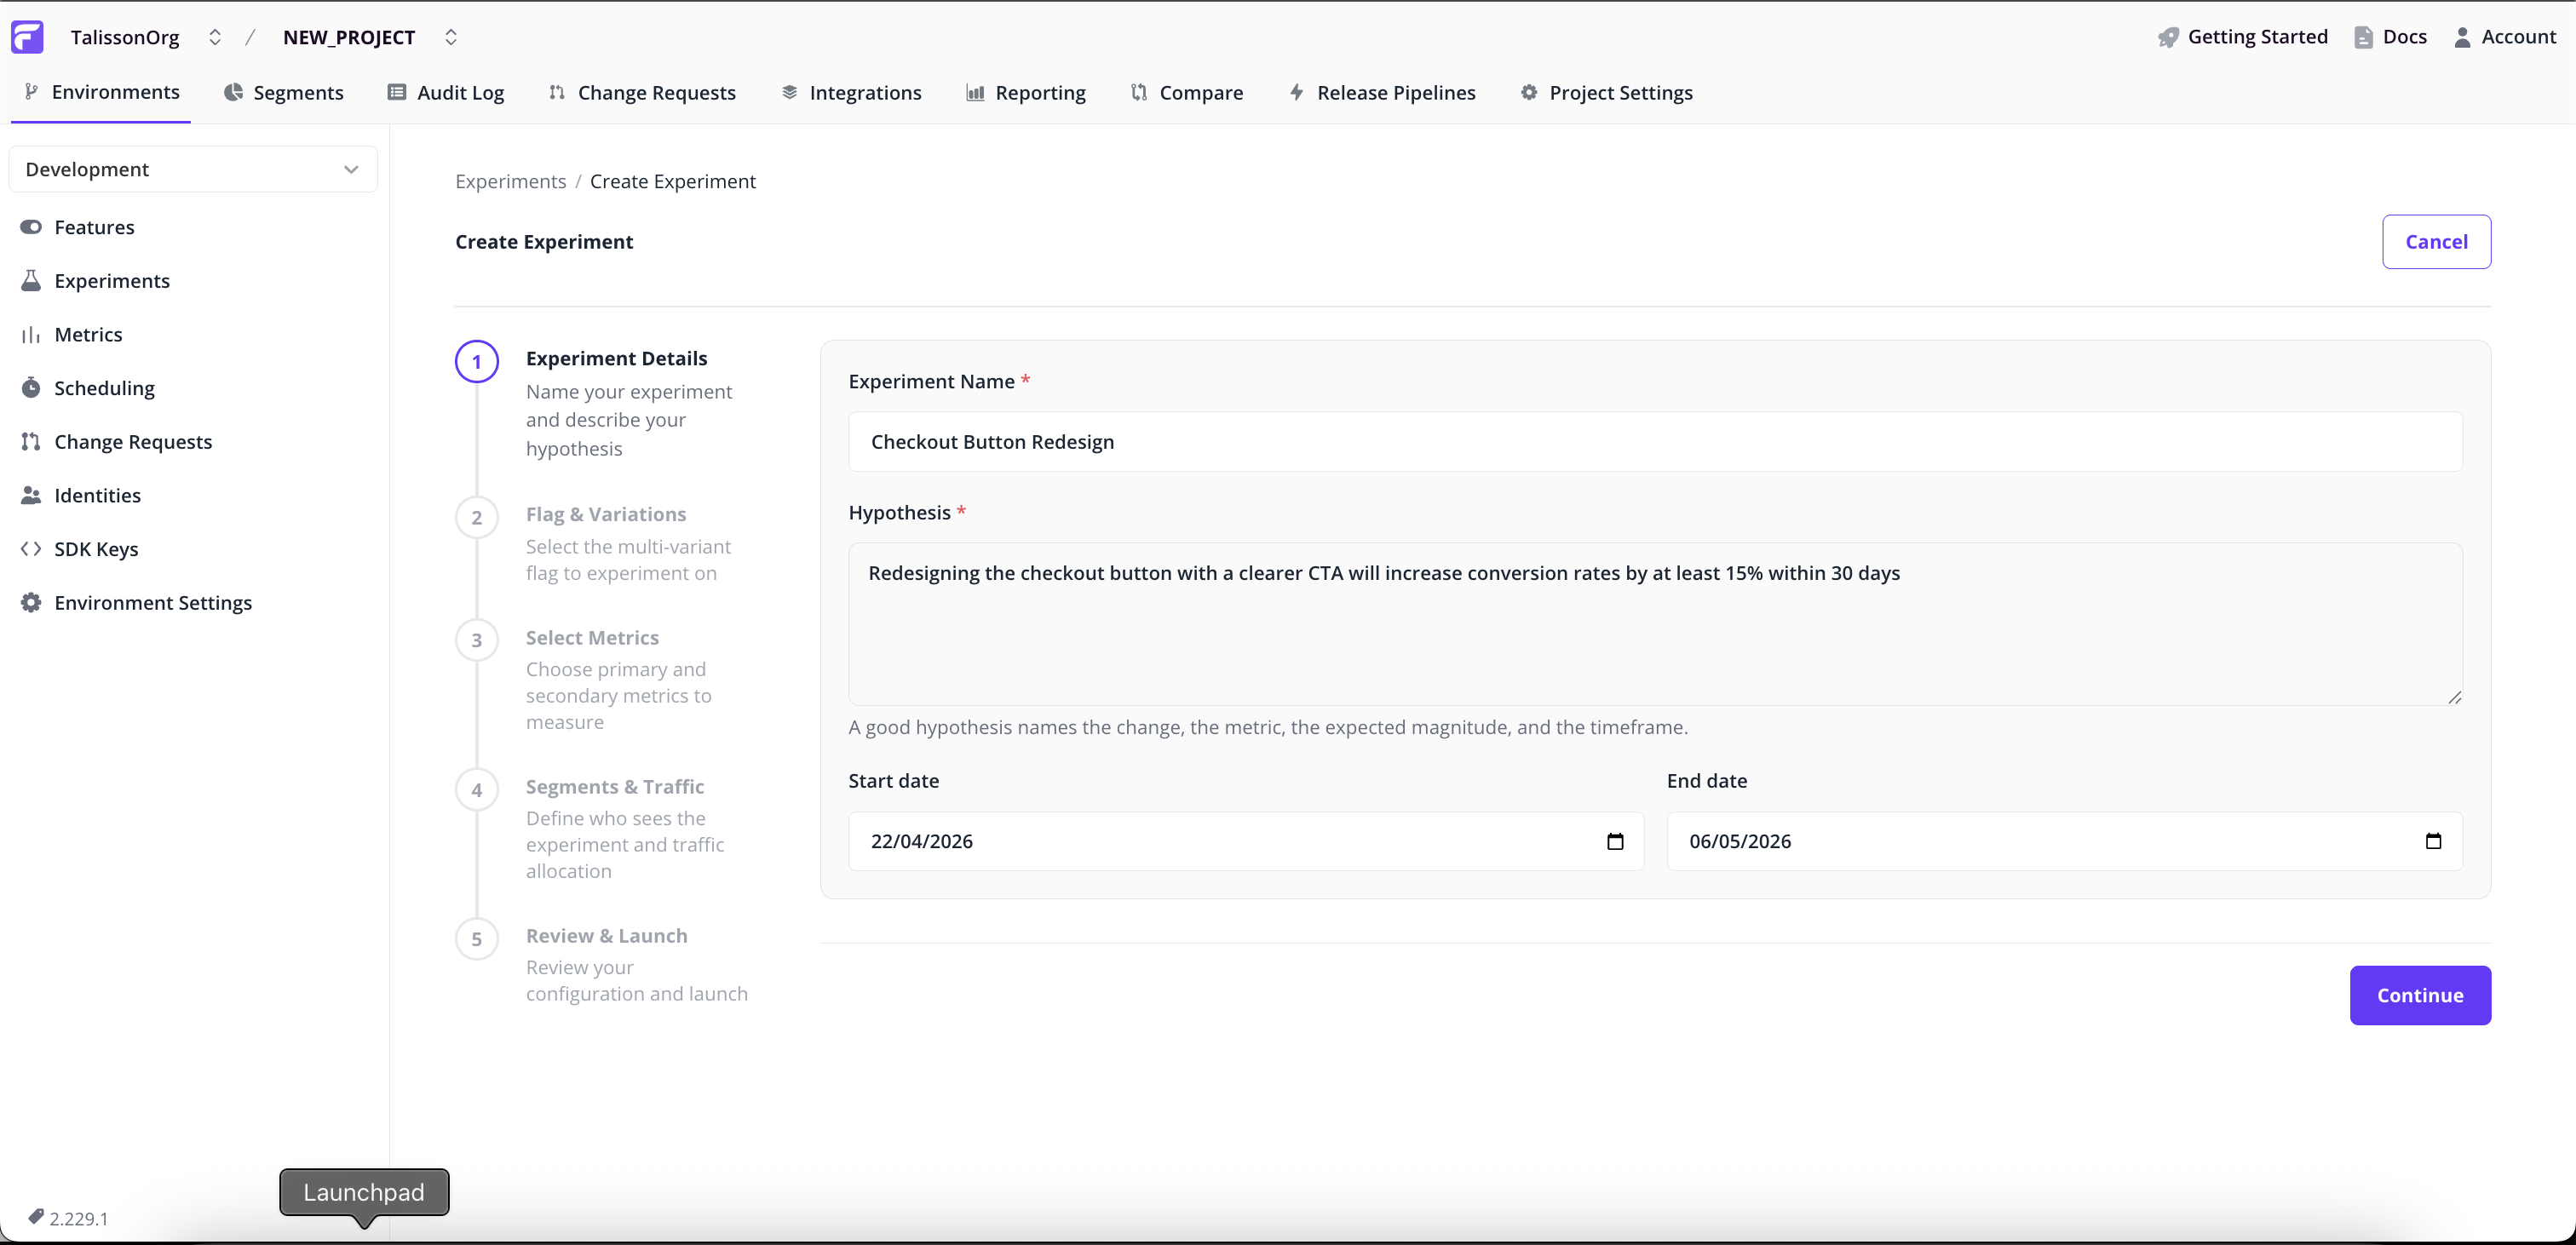
- Name — a short identifier (e.g.
checkout_paypal_button_test). - Hypothesis — required. State what you expect to happen and why. This becomes part of the experiment's permanent record so future team members can see the original intent.
- Start and end dates — default to today + 14 days. Adjust if you want to schedule the experiment for later or run for a different window.
Step 3: Flag & Variations
Screenshot placeholder — Flag picker with multi-variant flags; the single-variant blocking banner below for context. Target path:
/img/experimentation/wizard-flag-variations.png
- Pick the multivariate flag to experiment on. Single-variant flags are not eligible — the wizard blocks them with an explanation and a link to add a variation.
- Review the Variations table — read-only. These are the flag's existing multivariate values and become the experiment's control and treatment variations.
Experiments require at least one non-control variation. If the selected flag has none, the wizard shows a banner prompting you to add one on the flag's main page first.
Step 4: Select Metrics
Screenshot placeholder — Metric picker showing pre-selected metrics with the Primary / Secondary / Guardrail segmented control visible on a row. Target path:
/img/experimentation/wizard-metrics.png
Pick the metrics this experiment will track. Each metric has a role that tells Flagsmith how to interpret it:
- Primary — the metric that drives the verdict. Significance here determines whether the experiment succeeds.
- Secondary — informational. Tracked and displayed alongside primary, but doesn't influence the recommendation.
- Guardrail — a safety check. Used to detect regressions on metrics you don't want to break (e.g. page-load time, error rate).
- Select metrics from the list.
- For each selected metric, choose its role using the three-way segmented control.
- If you select multiple primary metrics, a soft warning appears — this is allowed but harder to interpret statistically.
Step 5: Segments & Traffic
Screenshot placeholder — Segment selector with an active conflict banner shown for context; traffic-split inputs below. Target path:
/img/experimentation/wizard-segment-traffic.png
- Pick the segment whose users will be eligible for the experiment. Everyone outside the segment sees the flag's environment default, unchanged.
- Set traffic weights — the percentage of eligible users assigned to each variation. Weights auto-balance: adjusting one rebalances the others proportionally. Click Split evenly to reset.
If the chosen flag already has a segment override for this segment, the wizard shows a conflict banner. Resolve the conflict (pick a different segment, or remove the override) before continuing — a running experiment on a segment with an override produces incorrect assignment.
Step 6: Review & Launch
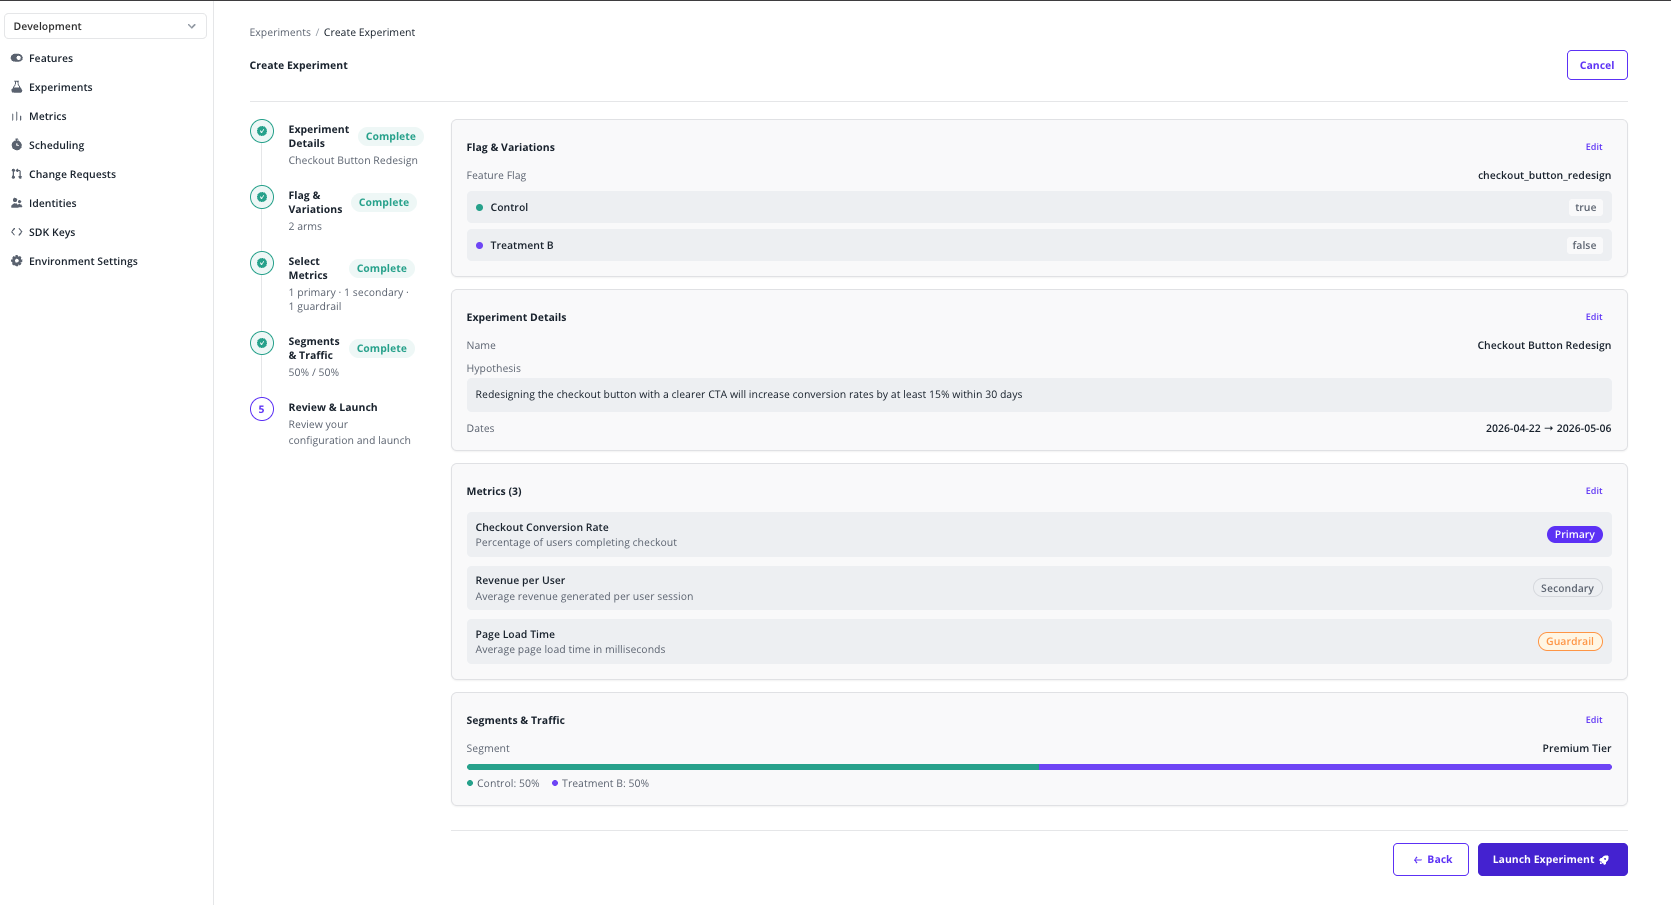
- Review the full configuration — details, flag, variations, metrics with roles, segment, traffic split, and dates.
- Click any section's Edit link to jump back to that step.
- Click Launch Experiment.
- Confirm the launch in the modal. Once confirmed, the experiment starts assigning traffic immediately and the flag begins splitting variations by the configured weights within the chosen segment.
Once launched, experiment configuration is locked for the duration of the run to preserve statistical validity. To change the setup, stop the experiment and create a new one.
3. Reading experiment results
From the Experiments list, click any running or completed experiment to open its Results dashboard.
Read the dashboard top-down:
Summary cards
- Lift vs. control on the primary metric
- Probability of being best — how confident the statistical engine is that the leading variation truly wins
- Sample size per variation — how many assigned identities have contributed data so far
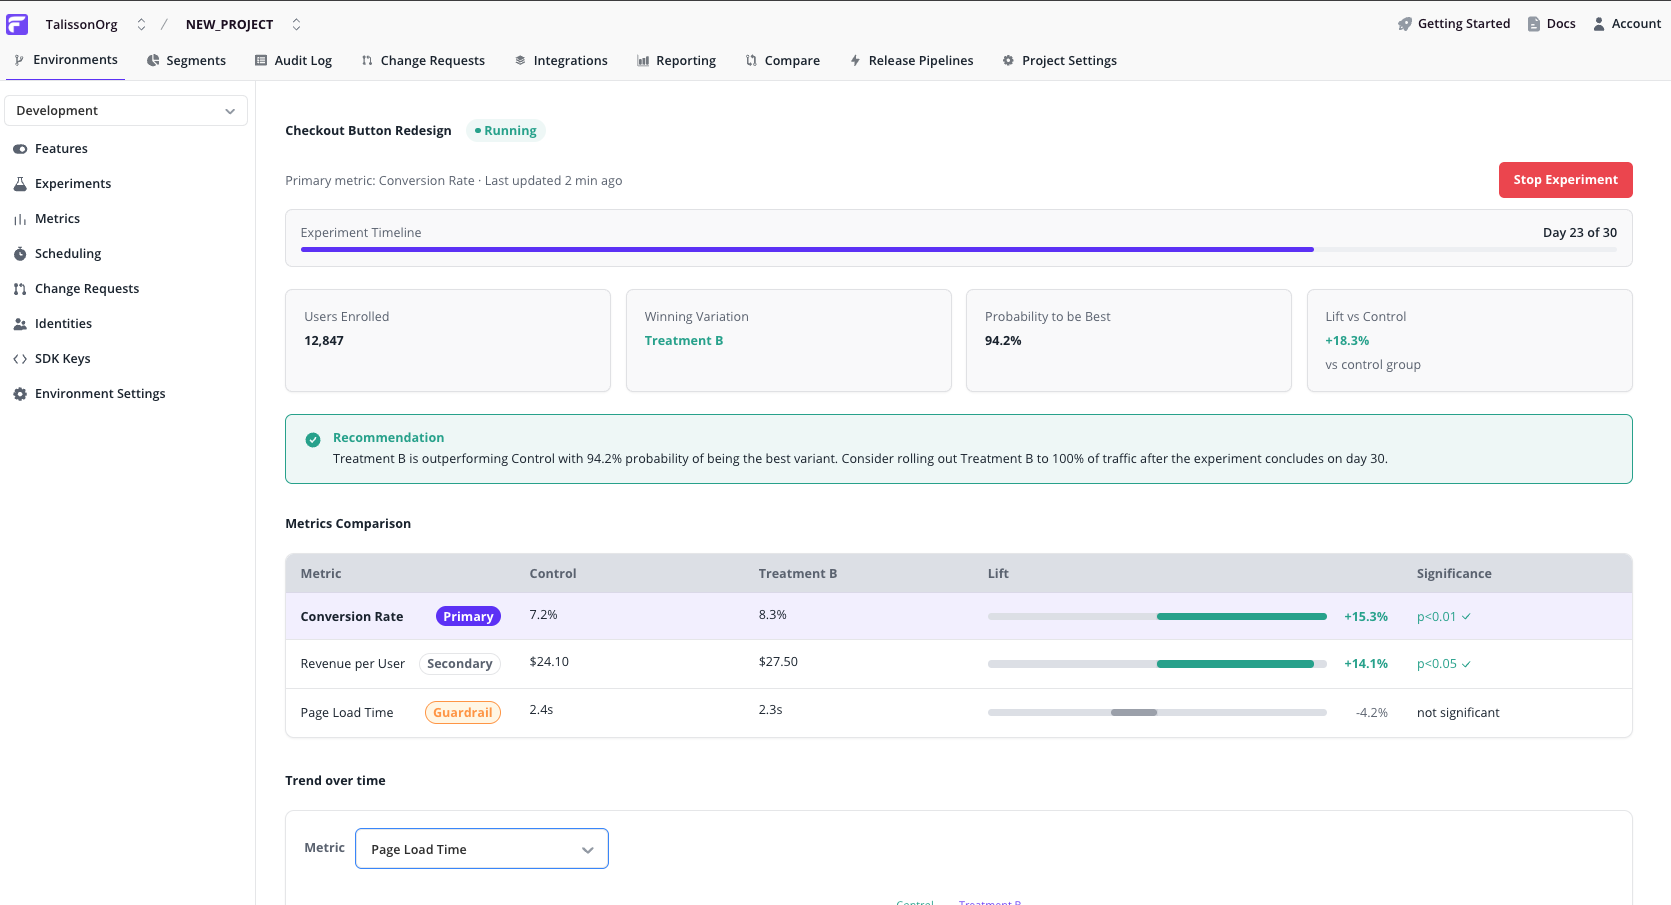
Recommendation callout
Screenshot placeholder — Recommendation callout — "Treatment B is outperforming Control with 94% probability" style. Target path:
/img/experimentation/results-recommendation-callout.png
A plain-language summary of the current state — which variation is leading, how confident the verdict is, and a suggested next action (continue, declare a winner, investigate).
Metrics comparison table
Screenshot placeholder — Metrics comparison table — primary row emphasised, guardrail badge visible, zero-centred lift bars. Target path:
/img/experimentation/results-comparison-table.png
One row per metric, with the primary row visually emphasised so your eye lands on the verdict-driving metric first. Each row shows:
- Role badge — Primary / Secondary / Guardrail
- Control value and Treatment value
- Lift bar — zero-centred, showing the relative change and its direction
- Significance — statistical confidence in the observed lift
Trend over time
Screenshot placeholder — Trend line chart with metric selector above it — control vs. treatment lines. Target path:
/img/experimentation/results-trend-chart.png
Below the table, a line chart plots each variation's metric value over the duration of the experiment. The metric selector lets you inspect any of the experiment's metrics independently.
This helps you distinguish a stable result from one that only recently flipped — if lines have been consistently separated for days, the verdict is more trustworthy than if they crossed yesterday.
What's next
- Learn more about multivariate flags — the building block every experiment sits on top of.
- Explore segments to define the audience for an experiment.
- Read about identities, the unit Flagsmith buckets users by when assigning variations.